See also:
forum.segger.com/index.php/Thr…nd-possible-improvements/
forum.segger.com/index.php/Thr…-possible-improvements-2/
1. again: why a start/stop button would be a good idea and add value (i.e. make the sampling feature usable):
Here is a gif, so you can see the problem (besides the big inconvenience that this procedure is); the timelines will be out of sync:
edit: the bigger issue here is that power and data timelines are not correctly synced.
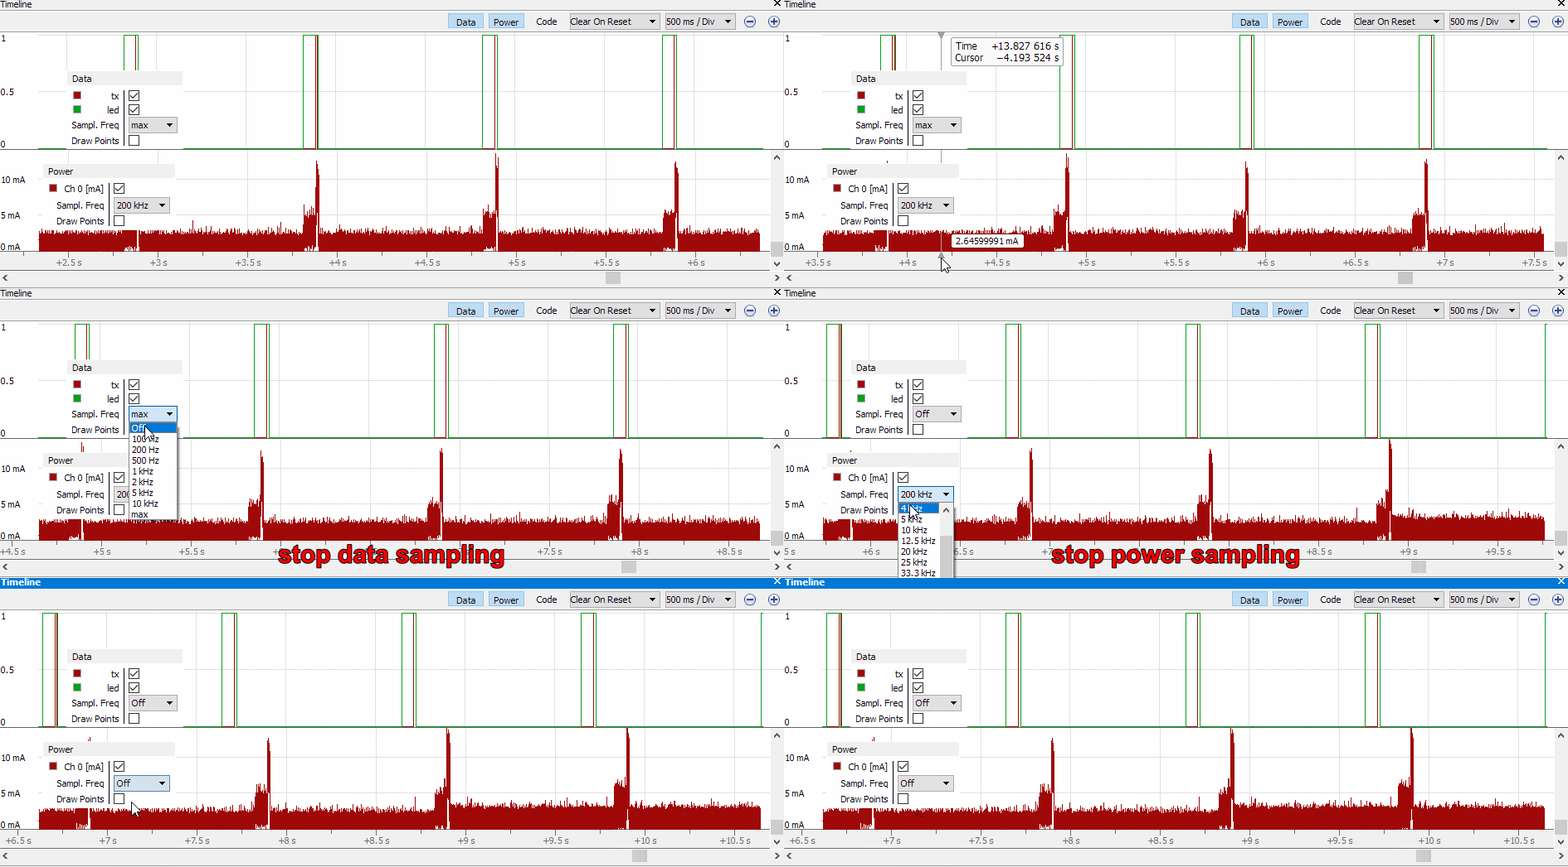
=> But why don’t I just disable the auto scroll (aka the missing pause button)?
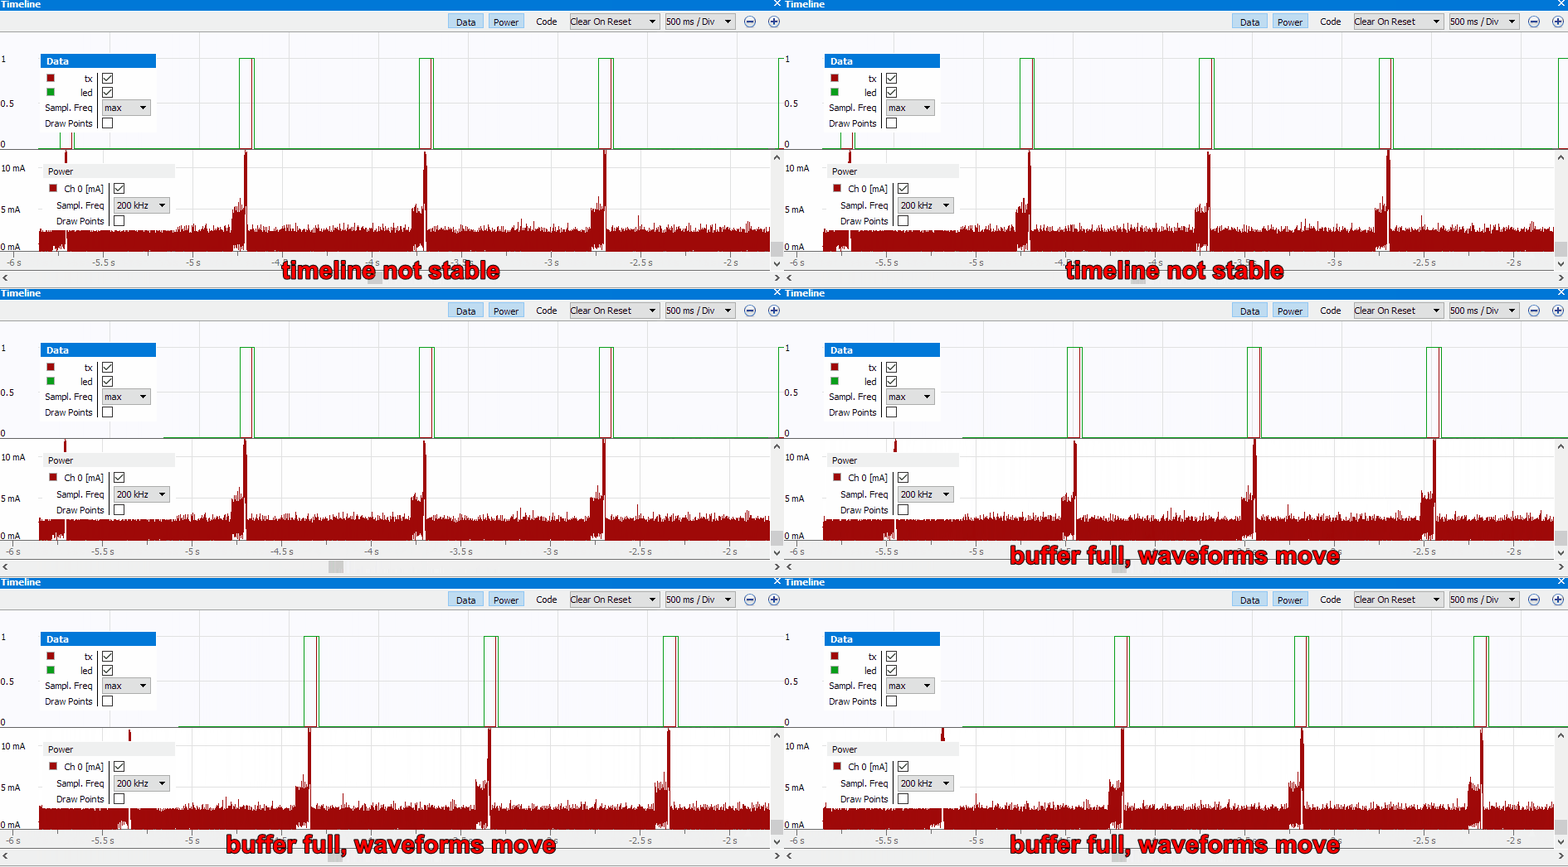
=> but what if I just increase the buffer size
2./11. another example of the zoom problem. I still cannot tell you how to reproduce it. maybe use ozone longer than just for a quick test?
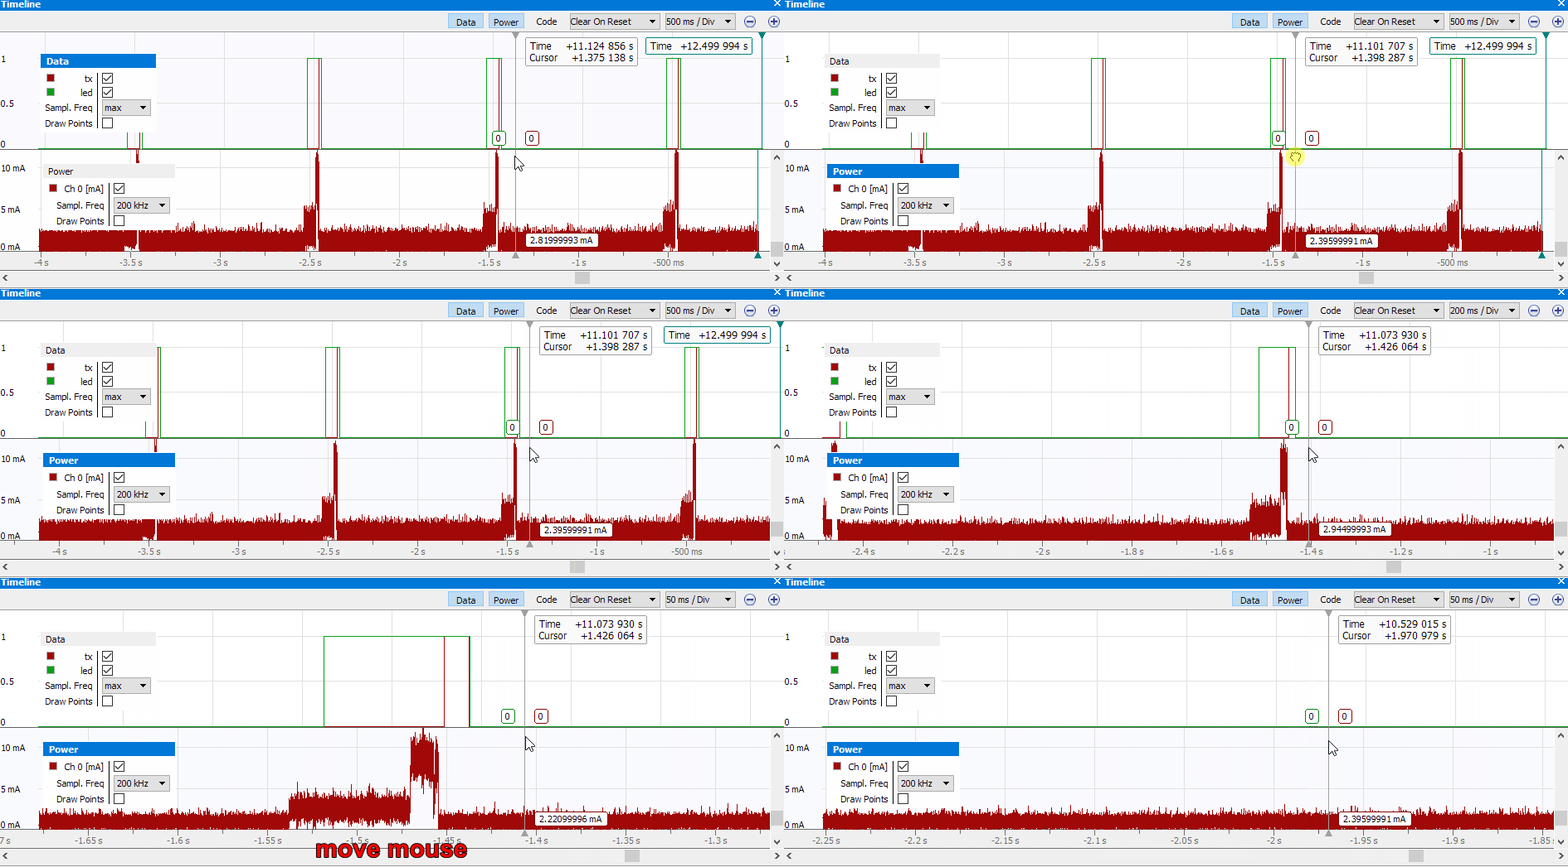
And more: Data and Power, or the time grid, may not be in sync after starting a session with sampling on
edit: I think the problem here, maybe also in other cases, is the scrollbar on the timeline. when it's present, the grids won't line up anymore.
Also notice how the timeline is not starting at 0s, but with the time of the first datapoint of the last run
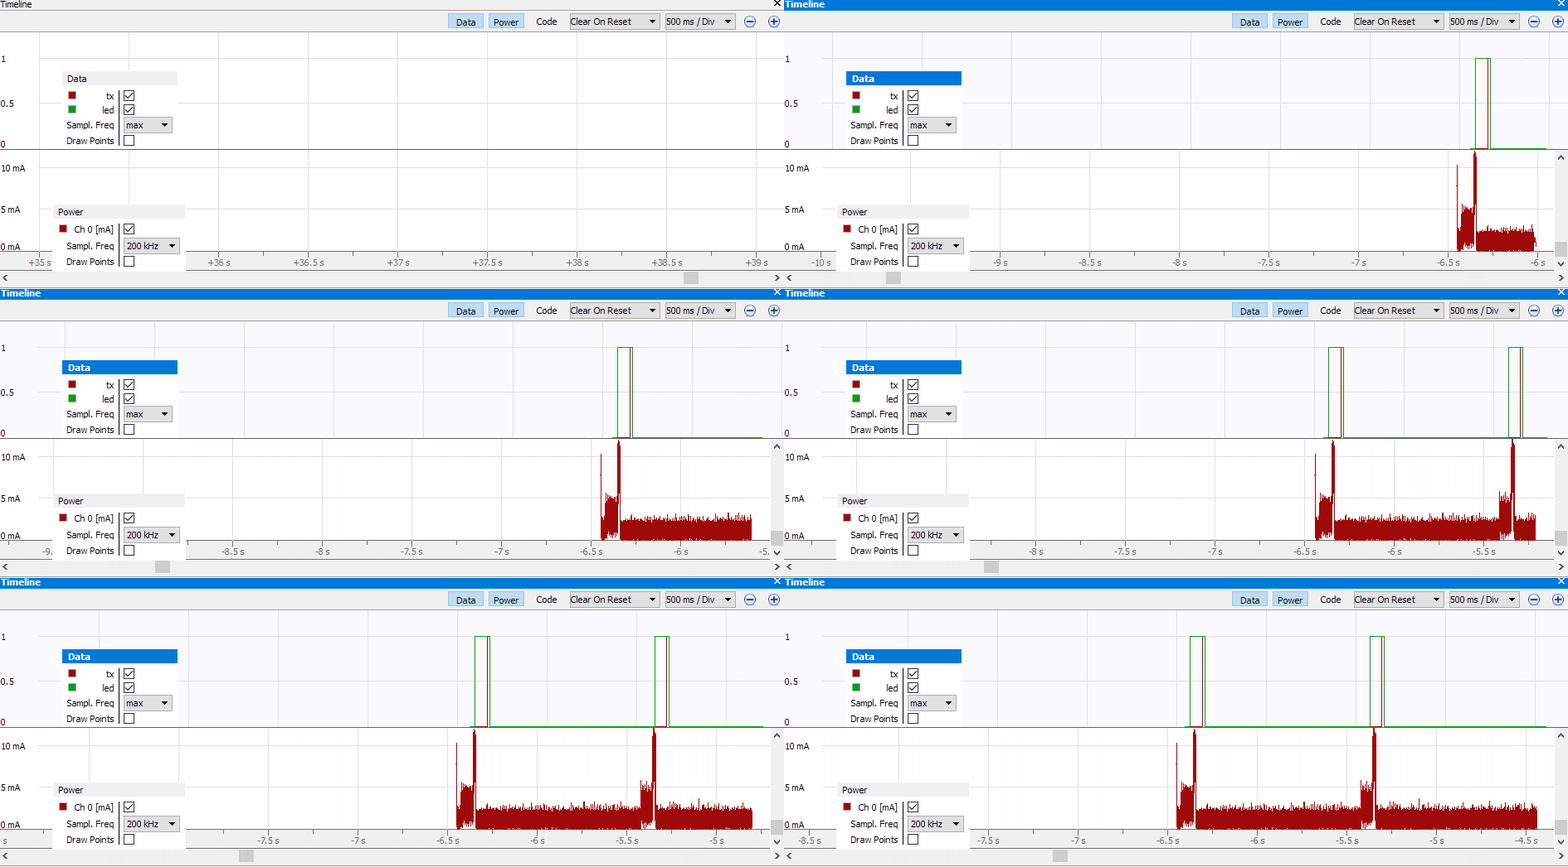
And another issue:
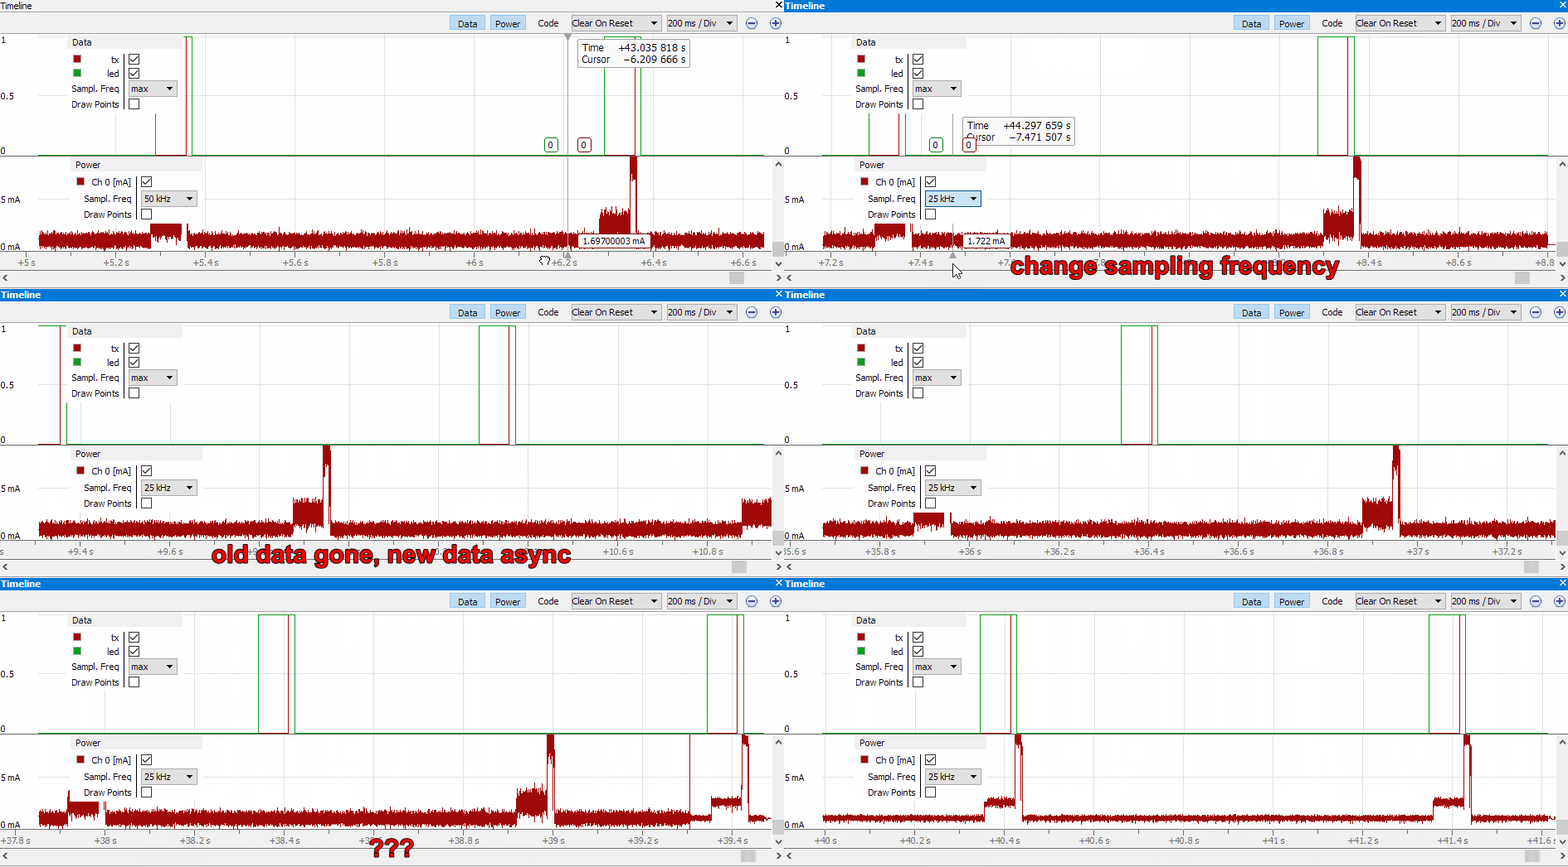
changing the sampling rate, makes data and power async and the old power samples are lost. after a while it kind of gets back into sync, but the noise changes.
edit: the change in noise is the change of the sampling rate, that just happens at some point seconds after I change the frequency settings in GUI.
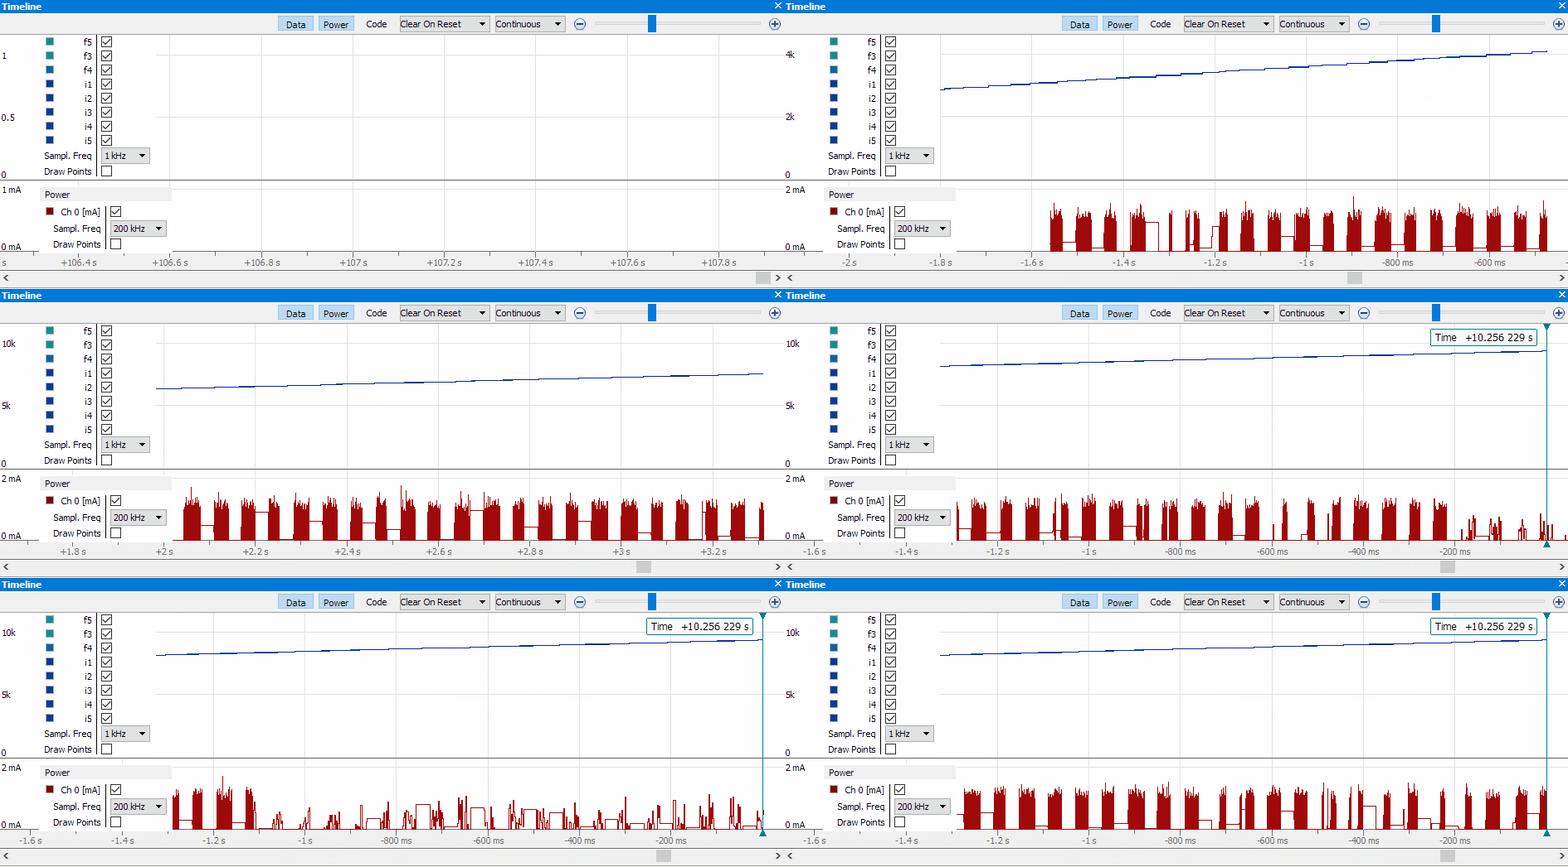
2. I already mentioned this in the first thread: sometimes while using the timeline, typically with sampling frequency set to max, Ozone gets really laggy, not only the timeline as shown in the gif, but everything in Ozone. Here is an example:
Furthermore there may be gaps in the sampled data. After stop/halt Ozone will react normally again, but the power sampling waveform will rapidly add data.
With the other problem above (change of power sampling frequency while running) it seems to me, there is maybe a major buffering issue either in Ozone or with J-Link.
USB speed has a noticeableinfluence, because it is happening a lot more often with an USB isolator (Full Speed, i.e. 12MBd), but it also happened without
The timeline feature is nice and it's the main reason I bought an Ultra+ and the main reason I would recommend it to others, but not in this condition, obviously.
The more I'm trying to use it, the worse it gets. I cannot test the code timeline, but my expectations are low.
Maybe you should rename the window to something like: "Timeline (pre-alpha, use at own risk, results may vary)".
14. even the video about the timeline feature is not working (the other videos work)
see segger.com/products/development-tools/ozone-j-link-debugger/
15. power sampling frequency setting
The setting can be set to e.g. 100kHz on the dropdown control but no sampling is happening, because internally it is set to off.
Reproduce: have working session with power sampling on, stop session, create new project with wizzard, start new session, power sampling is still set to e.g. 100kHz, but it wont start until you set the frequency again.
16. stop/sleep mode of target locks J-Link
when I have a target and I put it in stop/sleep mode without leaving the debug module on, J-link locks up. No error message, I cannot stop the debug session, I have to power-cycle the probe.
And yes, I'm aware that without the debug module J-Link cannot sample data, but it shouldn't lock up either.
17. after all thesebugs possible improvements, another one for the wish list:
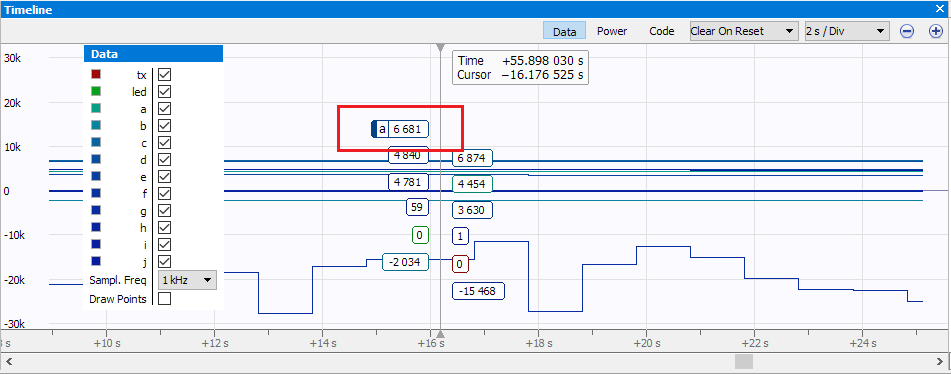
with many variables the bubbles on the cursor position become hard to distinguish, even without the bad default colors. Maybe add letters in front of the entries in the legend and the bubbles, so they can be matched if needed. Even better, add a tag column in the sampling table (with a,b,c .. as default) so I can (re)name them myself.
Also a colored bar could improve the visibility of the color itself, because the one pixel wide border is a bit thin.
18. wish: power sampling independent of debug session
The power sampling should be able to run all the time. So I can see the current of the target without debugging. Useful e.g. when I go to a sleep mode with debug module off and want to see if and how the target wakes up again. Or if I want to look at the startup behaviour.
The "J-Link / J-Trace supplies power to the target" setting should be a checkbox next to the sampling frequency so I can turn on/off the target at any time without a debug session. Also a "issue reset" button would be handy, so I can observe what happens after a non-POR.
Since it is a feature of the debug probe, it should not depend on a running debug session with the target. The RAM for the buffer is already blocked all the time, so why not fill it with data all the time.
19. more thoughts on timeline behaviour
The timeline should (selectable) either run all the time (see 18 why) with real time timestamps or with time synced to target run time, so it stops when the target is halted. In both variants, if I stop or change the frequency of any of the sampling features, while the target keeps running, there should be a gap in the data and not that weird behaviour that is happing right now, where data gets deleted and time correlation is lost.
20. Setting "J-Link / J-Trace supplies power to the target" behaviour
this setting is not working as I would expect it to work. If I set it to "yes", it will supply power once the debug session starts if it was off before. But after I stop the session it will stay on. If I then set the setting to "no", nothing changes until I power-cycle the probe; only then power is turned off. This is an issue if the behaviour of my target board depends on the POR.
Suggestion: make a checkbox as mentioned in 18 for any time user controlled power independent of debug session and another one that sais "supply power only while debugging" that turns on power only for the duration of the debug session. If power is already on, add a customizable time where it gets turned off before the start of the debug session, so everything can get a POR, or not if time=0.
21. wish (maybe a bit out of scope but just let me dream a bit about a more universal debug tool)
use unused pins on the debug probe and sample them as logic data that will endup in the timeline
forum.segger.com/index.php/Thr…nd-possible-improvements/
forum.segger.com/index.php/Thr…-possible-improvements-2/
1. again: why a start/stop button would be a good idea and add value (i.e. make the sampling feature usable):
Here is a gif, so you can see the problem (besides the big inconvenience that this procedure is); the timelines will be out of sync:
edit: the bigger issue here is that power and data timelines are not correctly synced.
=> But why don’t I just disable the auto scroll (aka the missing pause button)?
- First, because the result it is not stable
- Second, because if the buffer is full, the timelines will move
=> but what if I just increase the buffer size
- this only delays the problem
- buffer is always allocated in RAM. So as long as Ozone is open, it will occupy RAM, even when not debugging or sampling.
2./11. another example of the zoom problem. I still cannot tell you how to reproduce it. maybe use ozone longer than just for a quick test?
And more: Data and Power, or the time grid, may not be in sync after starting a session with sampling on
edit: I think the problem here, maybe also in other cases, is the scrollbar on the timeline. when it's present, the grids won't line up anymore.
Also notice how the timeline is not starting at 0s, but with the time of the first datapoint of the last run
And another issue:
changing the sampling rate, makes data and power async and the old power samples are lost. after a while it kind of gets back into sync, but the noise changes.
edit: the change in noise is the change of the sampling rate, that just happens at some point seconds after I change the frequency settings in GUI.
2. I already mentioned this in the first thread: sometimes while using the timeline, typically with sampling frequency set to max, Ozone gets really laggy, not only the timeline as shown in the gif, but everything in Ozone. Here is an example:
Furthermore there may be gaps in the sampled data. After stop/halt Ozone will react normally again, but the power sampling waveform will rapidly add data.
With the other problem above (change of power sampling frequency while running) it seems to me, there is maybe a major buffering issue either in Ozone or with J-Link.
USB speed has a noticeableinfluence, because it is happening a lot more often with an USB isolator (Full Speed, i.e. 12MBd), but it also happened without
The timeline feature is nice and it's the main reason I bought an Ultra+ and the main reason I would recommend it to others, but not in this condition, obviously.
The more I'm trying to use it, the worse it gets. I cannot test the code timeline, but my expectations are low.
Maybe you should rename the window to something like: "Timeline (pre-alpha, use at own risk, results may vary)".
14. even the video about the timeline feature is not working (the other videos work)
see segger.com/products/development-tools/ozone-j-link-debugger/
15. power sampling frequency setting
The setting can be set to e.g. 100kHz on the dropdown control but no sampling is happening, because internally it is set to off.
Reproduce: have working session with power sampling on, stop session, create new project with wizzard, start new session, power sampling is still set to e.g. 100kHz, but it wont start until you set the frequency again.
16. stop/sleep mode of target locks J-Link
when I have a target and I put it in stop/sleep mode without leaving the debug module on, J-link locks up. No error message, I cannot stop the debug session, I have to power-cycle the probe.
And yes, I'm aware that without the debug module J-Link cannot sample data, but it shouldn't lock up either.
17. after all these
with many variables the bubbles on the cursor position become hard to distinguish, even without the bad default colors. Maybe add letters in front of the entries in the legend and the bubbles, so they can be matched if needed. Even better, add a tag column in the sampling table (with a,b,c .. as default) so I can (re)name them myself.
Also a colored bar could improve the visibility of the color itself, because the one pixel wide border is a bit thin.
18. wish: power sampling independent of debug session
The power sampling should be able to run all the time. So I can see the current of the target without debugging. Useful e.g. when I go to a sleep mode with debug module off and want to see if and how the target wakes up again. Or if I want to look at the startup behaviour.
The "J-Link / J-Trace supplies power to the target" setting should be a checkbox next to the sampling frequency so I can turn on/off the target at any time without a debug session. Also a "issue reset" button would be handy, so I can observe what happens after a non-POR.
Since it is a feature of the debug probe, it should not depend on a running debug session with the target. The RAM for the buffer is already blocked all the time, so why not fill it with data all the time.
19. more thoughts on timeline behaviour
The timeline should (selectable) either run all the time (see 18 why) with real time timestamps or with time synced to target run time, so it stops when the target is halted. In both variants, if I stop or change the frequency of any of the sampling features, while the target keeps running, there should be a gap in the data and not that weird behaviour that is happing right now, where data gets deleted and time correlation is lost.
20. Setting "J-Link / J-Trace supplies power to the target" behaviour
this setting is not working as I would expect it to work. If I set it to "yes", it will supply power once the debug session starts if it was off before. But after I stop the session it will stay on. If I then set the setting to "no", nothing changes until I power-cycle the probe; only then power is turned off. This is an issue if the behaviour of my target board depends on the POR.
Suggestion: make a checkbox as mentioned in 18 for any time user controlled power independent of debug session and another one that sais "supply power only while debugging" that turns on power only for the duration of the debug session. If power is already on, add a customizable time where it gets turned off before the start of the debug session, so everything can get a POR, or not if time=0.
21. wish (maybe a bit out of scope but just let me dream a bit about a more universal debug tool)
use unused pins on the debug probe and sample them as logic data that will endup in the timeline
The post was edited 16 times, last by fraengers ().


