


New
Hello,
I’m facing an issue with a J-Trace PRO Cortex v. 3 debugger. We’ve several J-Links in use and I think I saw this on one or two others as well but I’m not sure about this.
I’m using this debugger in the lab connected to a PC - controlling out instrument as well – via USB3. I’ve always had problems during the past month that ~once a week the debugger ‘is gone’, meaning it looks like this:

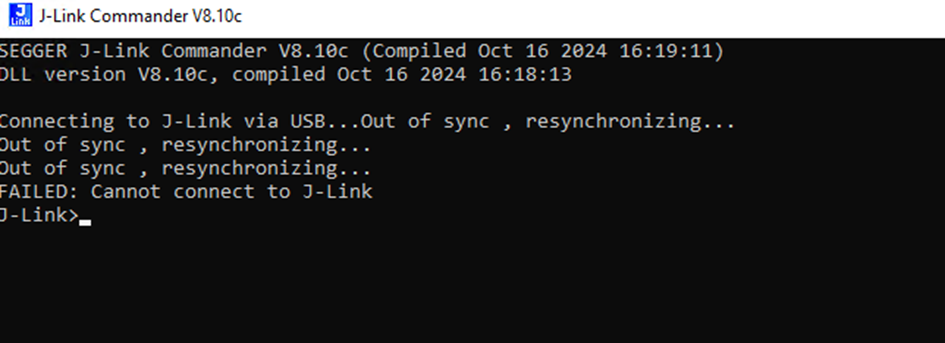
Looks similar to what was described here: forum.segger.com/index.php/Thr…iply-parallel-environment
I only do simple Ozone debugging, no tracing (at the moment), no RTT, etc. I search the forum some time ago and found the mentioned thread. As I, obviously, use a custom script (which is not perfect to be honest) I thought this could be the reason. At one point I added the LAN connection and changed out script to IP and used USB only as power source. During the last weeks I noticed two things, switching the script to IP did not change this behavior and I didn’t used the instrument for some time (other tasks to do) and even with not using the device and having our CPU run from flash, the J-Trace disappears at some point. I ran a test over the past weekend and connected the J-Trace to a USE power supply/charger. The result was the same, the device was gone this morning
I do not have any logfiles because I’m not using the device at all, or is there a way to get a log in this case? Is this a known issue?
I’m facing an issue with a J-Trace PRO Cortex v. 3 debugger. We’ve several J-Links in use and I think I saw this on one or two others as well but I’m not sure about this.
I’m using this debugger in the lab connected to a PC - controlling out instrument as well – via USB3. I’ve always had problems during the past month that ~once a week the debugger ‘is gone’, meaning it looks like this:
Looks similar to what was described here: forum.segger.com/index.php/Thr…iply-parallel-environment
I only do simple Ozone debugging, no tracing (at the moment), no RTT, etc. I search the forum some time ago and found the mentioned thread. As I, obviously, use a custom script (which is not perfect to be honest) I thought this could be the reason. At one point I added the LAN connection and changed out script to IP and used USB only as power source. During the last weeks I noticed two things, switching the script to IP did not change this behavior and I didn’t used the instrument for some time (other tasks to do) and even with not using the device and having our CPU run from flash, the J-Trace disappears at some point. I ran a test over the past weekend and connected the J-Trace to a USE power supply/charger. The result was the same, the device was gone this morning
I do not have any logfiles because I’m not using the device at all, or is there a way to get a log in this case? Is this a known issue?