


I am trying to use a Segger J-Link debugger with NXP ‘S32 Design Studio for Arm IDE’.
I am using an NXP ‘UCANS32K146’ evaluation board which has an NXP S32K146 processor.
I have imported some example code (libuavcan) into the IDE which builds successfully.
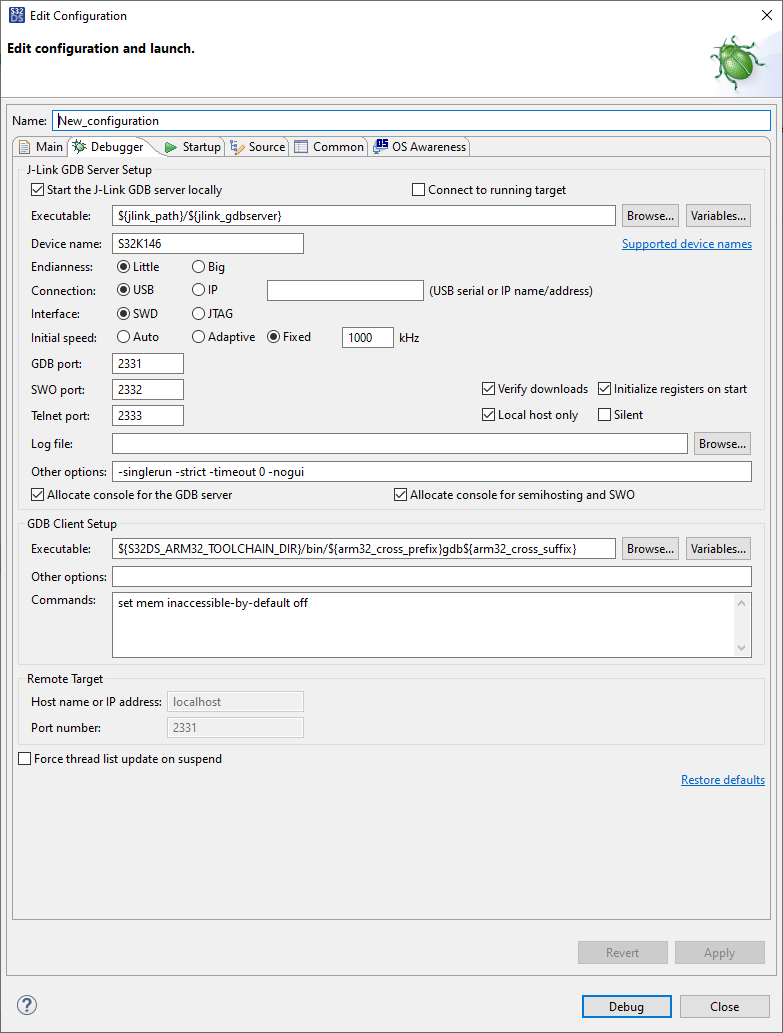
Below are the settings for the debugger…
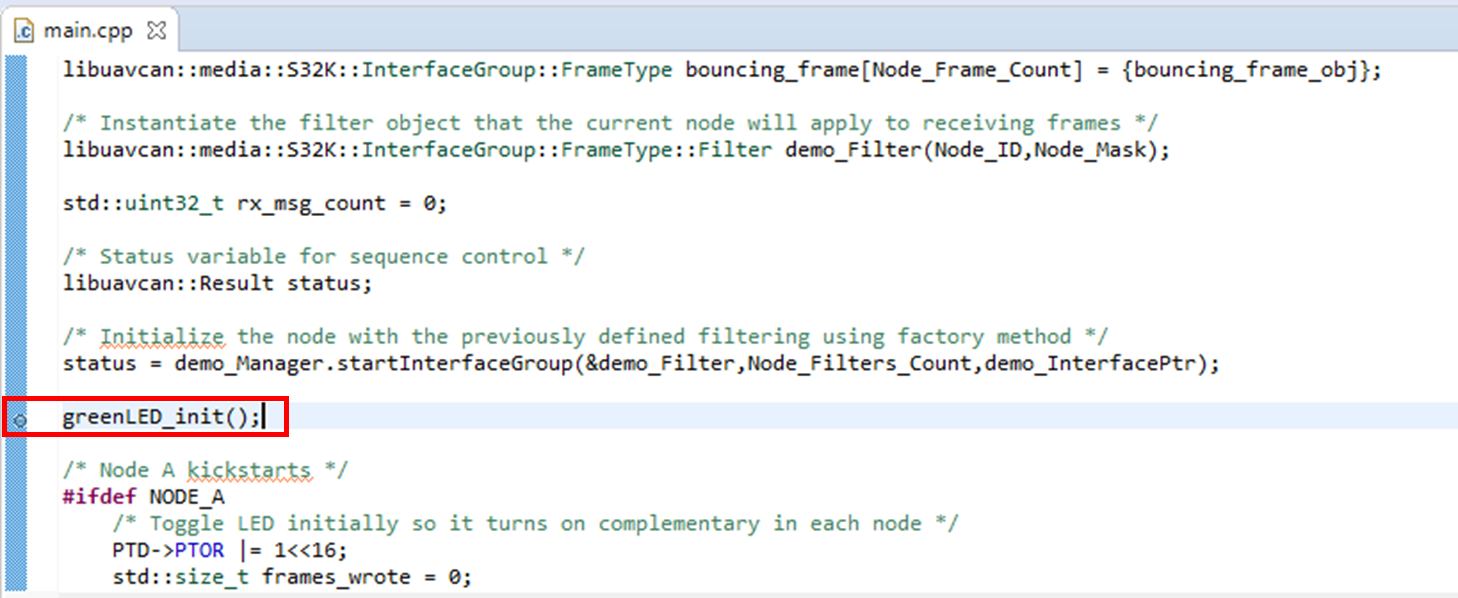
I set a breakpoint as shown...
But the debugger does not seem to run to or stop at the break point, it seems to be in reset ?
Attached is a copy of the console messages.
segger_log.txt
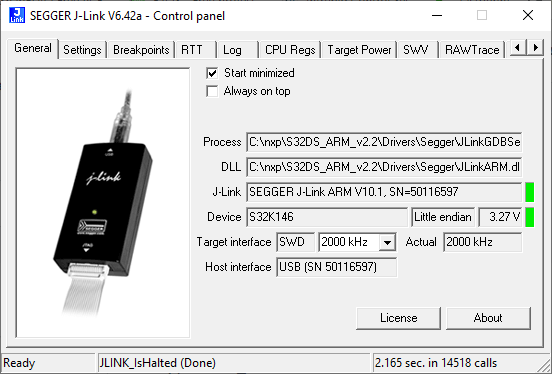
The Segger control panel shows the following...
The LED on the Segger looks to be orange/red (its hard to tell) which means its either in reset or there's a fault.
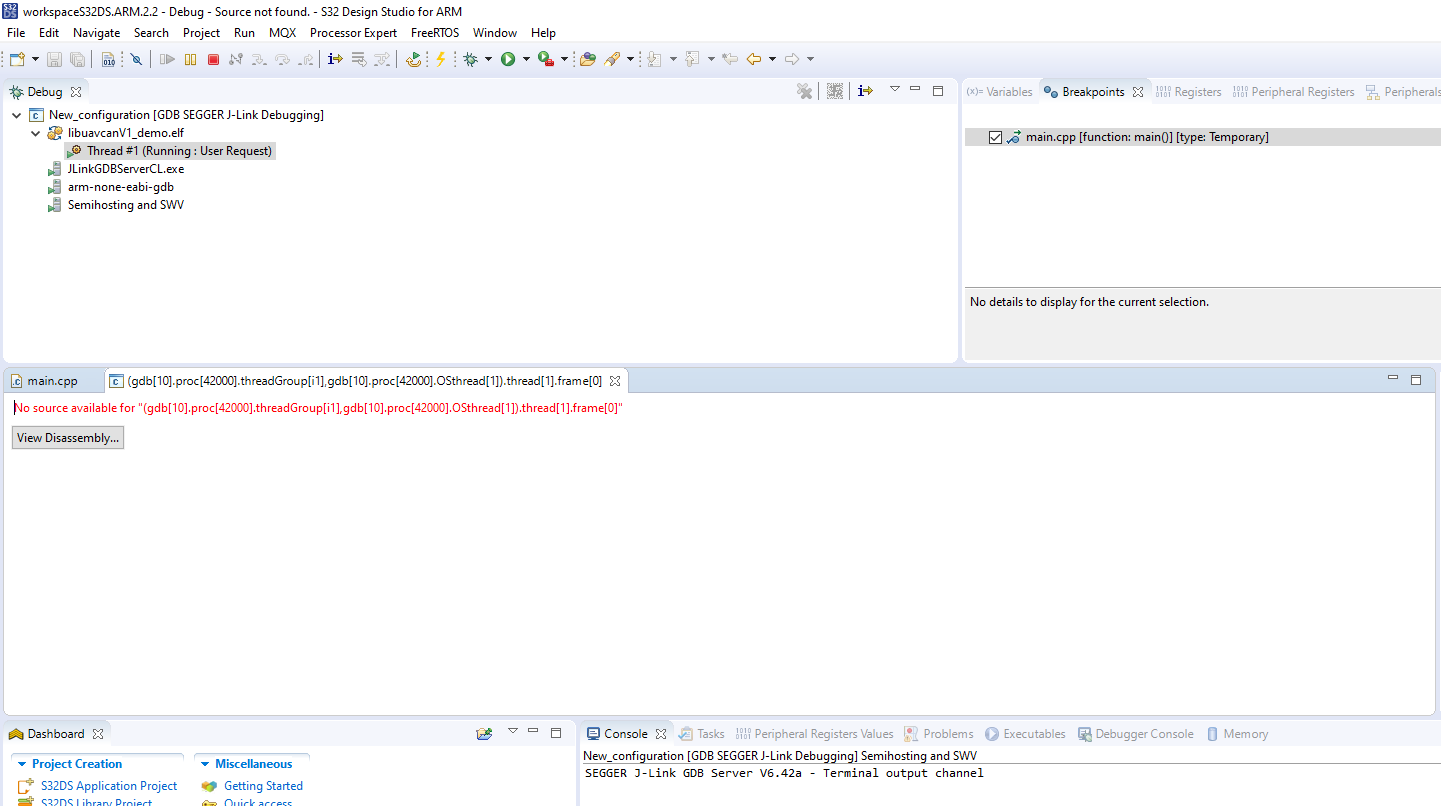
A screenshot of the IDE during debugging is shown below...
I was expecting the IDE to stop at that breakpoint so I could step through the lines of code.
Links below for reference:
I am using an NXP ‘UCANS32K146’ evaluation board which has an NXP S32K146 processor.
I have imported some example code (libuavcan) into the IDE which builds successfully.
Below are the settings for the debugger…
I set a breakpoint as shown...
But the debugger does not seem to run to or stop at the break point, it seems to be in reset ?
Attached is a copy of the console messages.
segger_log.txt
The Segger control panel shows the following...
The LED on the Segger looks to be orange/red (its hard to tell) which means its either in reset or there's a fault.
A screenshot of the IDE during debugging is shown below...
I was expecting the IDE to stop at that breakpoint so I could step through the lines of code.
Links below for reference:
- S32K146 UAVCAN V1 and MAVCAN Development System
- Segger J-Link Classic Base
- S32 Design Studio for Arm
- Processor S32K146
- Example software libuavcan