


Hello,
I am using J-Trace PRO Cortex M for interfacing with Renesas EK-RA6M4 board.
I have a problem and I hope so that you can help me.
Currently I am unable to program or erase or readback chip content.
Hardware setup:
I have Renesas development board EK-RA6M4
renesas.com/us/en/products/mic…ation-kit-ra6m4-mcu-group
with R7FA6M4AF3CFB uC, Cortex M33 core.
This board has Jlink Onboard Debugger that works for debugging from Renesas E2 studio. Connection is SWD.
Since I have a need to use J-Trace for development and J-LINK Plus later for production programming of these microcontrollers, I have a need to use JFlash.exe and Jlink Onboard Debugger is not applicable for that use case.
When I try to program or erase uC with external debugger I receive error in JFlash.
J-Trace PRO Cortex M is recently bought so it does support uC, per guideline on link: wiki.segger.com/RA6M4#Tracing_on_Renesas_R7FA6M4
Example project from aforementioned link "Example Project: Renesas_R7FA6M4_TraceBuffer.zip " works successfully from Ozone. I am able to have trace functionality and it is a sign that connection is good between
J-Trace PRO and target uC. I should mention that jumpers on evaluation board are setup for usage of external debugger.
However, if I try to use J flash for programming/erasing or read back i have this error:
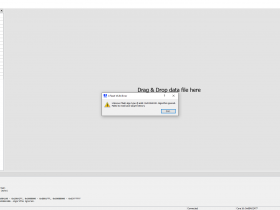
J Flash console log is:
Display All
Is some additional setup needed for J Flash in order to work correctly with the uC?
I am using J-Trace PRO Cortex M for interfacing with Renesas EK-RA6M4 board.
I have a problem and I hope so that you can help me.
Currently I am unable to program or erase or readback chip content.
Hardware setup:
I have Renesas development board EK-RA6M4
renesas.com/us/en/products/mic…ation-kit-ra6m4-mcu-group
with R7FA6M4AF3CFB uC, Cortex M33 core.
This board has Jlink Onboard Debugger that works for debugging from Renesas E2 studio. Connection is SWD.
Since I have a need to use J-Trace for development and J-LINK Plus later for production programming of these microcontrollers, I have a need to use JFlash.exe and Jlink Onboard Debugger is not applicable for that use case.
When I try to program or erase uC with external debugger I receive error in JFlash.
J-Trace PRO Cortex M is recently bought so it does support uC, per guideline on link: wiki.segger.com/RA6M4#Tracing_on_Renesas_R7FA6M4
Example project from aforementioned link "Example Project: Renesas_R7FA6M4_TraceBuffer.zip " works successfully from Ozone. I am able to have trace functionality and it is a sign that connection is good between
J-Trace PRO and target uC. I should mention that jumpers on evaluation board are setup for usage of external debugger.
However, if I try to use J flash for programming/erasing or read back i have this error:
J Flash console log is:
Source Code
- Application log started
- - J-Flash V6.94 (J-Flash compiled Jan 8 2021 13:01:52)
- - JLinkARM.dll V6.94 (DLL compiled Jan 8 2021 13:01:30)
- Reading flash device list [C:\Program Files (x86)\SEGGER\JLink\ETC/JFlash/Flash.csv] ...
- - List of flash devices read successfully (451 Devices)
- Reading MCU device list ...
- - List of MCU devices read successfully (8230 Devices)
- Creating new project ...
- - New project created successfully
- Connecting ...
- - Connecting via USB to probe/ programmer device 0
- - Probe/ Programmer firmware: J-Trace PRO V2 Cortex-M compiled Jan 4 2021 16:19:11
- - Device "R7FA6M4AF" selected.
- - Target interface speed: 4000 kHz (Fixed)
- - VTarget = 3.322V
- - InitTarget() start
- - Determining TrustZone configuration...
- - Secure Debug: Enabled (SSD)
- - Determining currently configured transfer type by reading the AHB-AP CSW register.
- - --> Correct transfer type configured. Done.
- - InitTarget() end
- - Found SW-DP with ID 0x6BA02477
- - DPIDR: 0x6BA02477
- - Scanning AP map to find all available APs
- - AP[2]: Stopped AP scan as end of AP map has been reached
- - AP[0]: AHB-AP (IDR: 0x84770001)
- - AP[1]: APB-AP (IDR: 0x54770002)
- - Iterating through AP map to find AHB-AP to use
- - AP[0]: Core found
- - AP[0]: AHB-AP ROM base: 0xE00FE000
- - CPUID register: 0x410FD214. Implementer code: 0x41 (ARM)
- - Found Cortex-M33 r0p4, Little endian.
- - FPUnit: 8 code (BP) slots and 0 literal slots
- - Security extension: implemented
- - Secure debug: enabled
- - CoreSight components:
- - ROMTbl[0] @ E00FE000
- - ROMTbl[0][0]: E0044000, CID: B105900D, PID: 005BB906 CTI
- - ROMTbl[0][1]: E0047000, CID: B105900D, PID: 003BB908 CSTF
- - ROMTbl[0][2]: E0048000, CID: B105900D, PID: 001BB961 TMC
- - ROMTbl[0][3]: E0049000, CID: B105F00D, PID: 001BB101 TSG
- - ROMTbl[0][4]: E0040000, CID: B105900D, PID: 000BBD21 Cortex-M33
- - ROMTbl[0][5]: E00FF000, CID: B105100D, PID: 000BB4C9 ROM Table
- - ROMTbl[1] @ E00FF000
- - ROMTbl[1][0]: E000E000, CID: B105900D, PID: 000BBD21 Cortex-M33
- - ROMTbl[1][1]: E0001000, CID: B105900D, PID: 000BBD21 DWT
- - ROMTbl[1][2]: E0002000, CID: B105900D, PID: 000BBD21 FPB
- - ROMTbl[1][3]: E0000000, CID: B105900D, PID: 000BBD21 ITM
- - ROMTbl[1][5]: E0041000, CID: B105900D, PID: 002BBD21 ETM
- - ROMTbl[1][6]: E0042000, CID: B105900D, PID: 000BBD21 CSS600-CTI
- - Executing init sequence ...
- - Executing Reset (0, 0 ms)
- - Initialized successfully
- - Target interface speed: 4000 kHz (Fixed)
- - CPU clock frequency: 2072 kHz (Auto detected)
- - Found 1 JTAG device. Core ID: 0x6BA02477 (None)
- - Connected successfully
- Reading entire flash chip ...
- - 199 sectors, 4 ranges, 0x0 - 0xFFFFF, 0x100A100 - 0x100A2FF, 0x8000000 - 0x8001FFF, 0x60000000 - 0x63FFFFFF
- - ERROR: Unknown flash algo type @ addr. 0x0100A100. Algorithm ignored.
- - ERROR: Failed to read back target memory
- Disconnecting ...
- - Disconnected