


Hi,
I am starting to use Ozone with J-Link (Ultra+) on an ARM Cortex A9 architecture. I manage to connect to the target and to make first debugging steps.
The startup code (and data) are located in internal RAM at memory address 0xFFFF0000.
After a few single steps, I tell the debugger to run to the next breakpoint which is set at the entry to the main function.
Inside the main function, the first instruction is:
PUSH {R4-R5,R11,LR} (with the stack pointer being correctly set)
This makes the J-Link isse a JLINK_ReadMemU32(0x600FC89C) comand.
The memory address 0x600FC89C is not in the device's memory map and thus it fails.
After this step, I can no longer step with the debugger.
Any idea, why J-Link makes the read access to an invalid address?
I have extended the j-link log data. Here is the last bit that ends up with the illegal memory access:
T0F20 15297:897 JLINK_Step() -- CPU_ReadMem(64 bytes @ 0xFFFF4E40) -- Updating DA cache (64 bytes @ 0xFFFF4E40) -- Read from DA cache (4 bytes @ 0xFFFF4E68) -- Not simulated -- CPU_WriteMem(4 bytes @ 0x80110100) -- CPU_WriteMem(4 bytes @ 0x80110140) -- CPU_WriteMem(4 bytes @ 0x80110104) -- CPU_WriteMem(4 bytes @ 0x80110144) -- CPU_WriteMem(4 bytes @ 0x80110148) -- CPU_WriteMem(4 bytes @ 0x8011014C) -- CPU_WriteMem(4 bytes @ 0x80110150) -- CPU_WriteMem(4 bytes @ 0x80110154) returns 0x00
(0023ms, 45405ms total)
T0F20 15297:920 JLINK_ReadReg(R13_SVC) returns 0xFFFFF5E8 (0002ms, 45407ms total)
T0F20 15297:922 JLINK_ReadReg(R15 (PC)) returns 0xFFFF4E6C (0000ms, 45407ms total)
T2BBC 15297:923 JLINK_ReadRegs(NumRegs = 18, Indexes: 0, 1, 2, 3, 4, 5, 6, 7, 10, 11, 12, 13, 14, 26, 27, 9, 8, 25) -- R0=0xFFFFE5FC, R1=0xFFFFE5F8, R2=0x00, R3=0x00, R4=0xFFFFE1E8, R5=0xFFFFFD14, R6=0x00, R7=0x00, R8_USR=0x00, R9_USR=0x00, R10_USR=0x00, R11_USR=0x00, R12_USR=0x00, R13_SVC=0xFFFFF5E8, R14_SVC=0xFFFF0100, R15 (PC)=0xFFFF4E6C, CPSR=0x600001D3, SPSR_SVC=0x600F4884 returns 0x00 (0004ms, 45411ms total)
T2BBC 15297:928 JLINK_GetDebugInfo(0x10F = JLINKARM_DEBUG_INFO_HAS_CORTEX_M_SECURITY_EXT_INDEX) returns 0xFFFFFFFF (0000ms, 45411ms total)
T0F20 15297:928 JLINK_ReadReg(FPS26) returns 0x600F4884 (0044ms, 45455ms total)
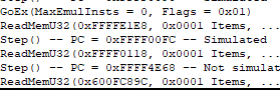
T0F20 15297:973 JLINK_ReadMemU32(0x600F489C, 0x0001 Items, ...) -- CPU_ReadMem(4 bytes @ 0x600F489C) returns 0xFFFFFFFF (0021ms, 45476ms total)
15298:546 JLINK_IsHalted() returns TRUE (0001ms, 45477ms total)
It seems to be related to register FPS26, I guess.
Btw. my SoC is a single core Altera (Intel) Cyclone V.
I am starting to use Ozone with J-Link (Ultra+) on an ARM Cortex A9 architecture. I manage to connect to the target and to make first debugging steps.
The startup code (and data) are located in internal RAM at memory address 0xFFFF0000.
After a few single steps, I tell the debugger to run to the next breakpoint which is set at the entry to the main function.
Inside the main function, the first instruction is:
PUSH {R4-R5,R11,LR} (with the stack pointer being correctly set)
This makes the J-Link isse a JLINK_ReadMemU32(0x600FC89C) comand.
The memory address 0x600FC89C is not in the device's memory map and thus it fails.
After this step, I can no longer step with the debugger.
Any idea, why J-Link makes the read access to an invalid address?
I have extended the j-link log data. Here is the last bit that ends up with the illegal memory access:
T0F20 15297:897 JLINK_Step() -- CPU_ReadMem(64 bytes @ 0xFFFF4E40) -- Updating DA cache (64 bytes @ 0xFFFF4E40) -- Read from DA cache (4 bytes @ 0xFFFF4E68) -- Not simulated -- CPU_WriteMem(4 bytes @ 0x80110100) -- CPU_WriteMem(4 bytes @ 0x80110140) -- CPU_WriteMem(4 bytes @ 0x80110104) -- CPU_WriteMem(4 bytes @ 0x80110144) -- CPU_WriteMem(4 bytes @ 0x80110148) -- CPU_WriteMem(4 bytes @ 0x8011014C) -- CPU_WriteMem(4 bytes @ 0x80110150) -- CPU_WriteMem(4 bytes @ 0x80110154) returns 0x00
(0023ms, 45405ms total)
T0F20 15297:920 JLINK_ReadReg(R13_SVC) returns 0xFFFFF5E8 (0002ms, 45407ms total)
T0F20 15297:922 JLINK_ReadReg(R15 (PC)) returns 0xFFFF4E6C (0000ms, 45407ms total)
T2BBC 15297:923 JLINK_ReadRegs(NumRegs = 18, Indexes: 0, 1, 2, 3, 4, 5, 6, 7, 10, 11, 12, 13, 14, 26, 27, 9, 8, 25) -- R0=0xFFFFE5FC, R1=0xFFFFE5F8, R2=0x00, R3=0x00, R4=0xFFFFE1E8, R5=0xFFFFFD14, R6=0x00, R7=0x00, R8_USR=0x00, R9_USR=0x00, R10_USR=0x00, R11_USR=0x00, R12_USR=0x00, R13_SVC=0xFFFFF5E8, R14_SVC=0xFFFF0100, R15 (PC)=0xFFFF4E6C, CPSR=0x600001D3, SPSR_SVC=0x600F4884 returns 0x00 (0004ms, 45411ms total)
T2BBC 15297:928 JLINK_GetDebugInfo(0x10F = JLINKARM_DEBUG_INFO_HAS_CORTEX_M_SECURITY_EXT_INDEX) returns 0xFFFFFFFF (0000ms, 45411ms total)
T0F20 15297:928 JLINK_ReadReg(FPS26) returns 0x600F4884 (0044ms, 45455ms total)
T0F20 15297:973 JLINK_ReadMemU32(0x600F489C, 0x0001 Items, ...) -- CPU_ReadMem(4 bytes @ 0x600F489C) returns 0xFFFFFFFF (0021ms, 45476ms total)
15298:546 JLINK_IsHalted() returns TRUE (0001ms, 45477ms total)
It seems to be related to register FPS26, I guess.
Btw. my SoC is a single core Altera (Intel) Cyclone V.
The post was edited 2 times, last by alemannia ().