


Hi, I'm Matthew. I use
- 64-bit SES 3.26 on 64-bit Windows 10
- J-Link Plus or onboard J-Link (Nordic's dev kits have a J-Link on the board itself)
- J-Link 6.16h
- Nordic's PCA10040 v1.1.1 board (this board uses nRF52832-QFAA MCU)
- STM32F4 Discovery board
In the past, I used IAR EWARM 7 and Keil MDK 5.
[img]http://www.jkelec.co.kr/img/lecture/arm_app/img/iar_23.png[/img]
1.IAR provides an option called "Run to main". If this is unchecked, the debugger starts from the startup code.
Does SES has a feature to start debugging from the startup code?
2. After building the project, SES shows the memory usage and the debugger view show it in detail.
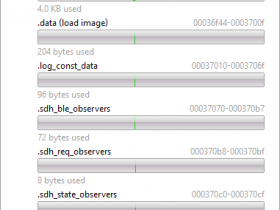
How can I get the code size from SES after the build is complete?
I use GCC and various optimization levels to I wish to compare the code size after building the project.
-Best Regards
- 64-bit SES 3.26 on 64-bit Windows 10
- J-Link Plus or onboard J-Link (Nordic's dev kits have a J-Link on the board itself)
- J-Link 6.16h
- Nordic's PCA10040 v1.1.1 board (this board uses nRF52832-QFAA MCU)
- STM32F4 Discovery board
In the past, I used IAR EWARM 7 and Keil MDK 5.
[img]http://www.jkelec.co.kr/img/lecture/arm_app/img/iar_23.png[/img]
1.IAR provides an option called "Run to main". If this is unchecked, the debugger starts from the startup code.
Does SES has a feature to start debugging from the startup code?
2. After building the project, SES shows the memory usage and the debugger view show it in detail.
How can I get the code size from SES after the build is complete?
I use GCC and various optimization levels to I wish to compare the code size after building the project.
-Best Regards
-Best Regards, Matthew
